THE CASQ-IT DASHBOARD: KPIS, ANALYSES AND TASKS AT A GLANCE
Published: December 27, 2022
Last update: July 7, 2025
Cross-site KPIs, cross-module analyses and current tasks – and the ability to directly navigate into the respective process at the click of a mouse.
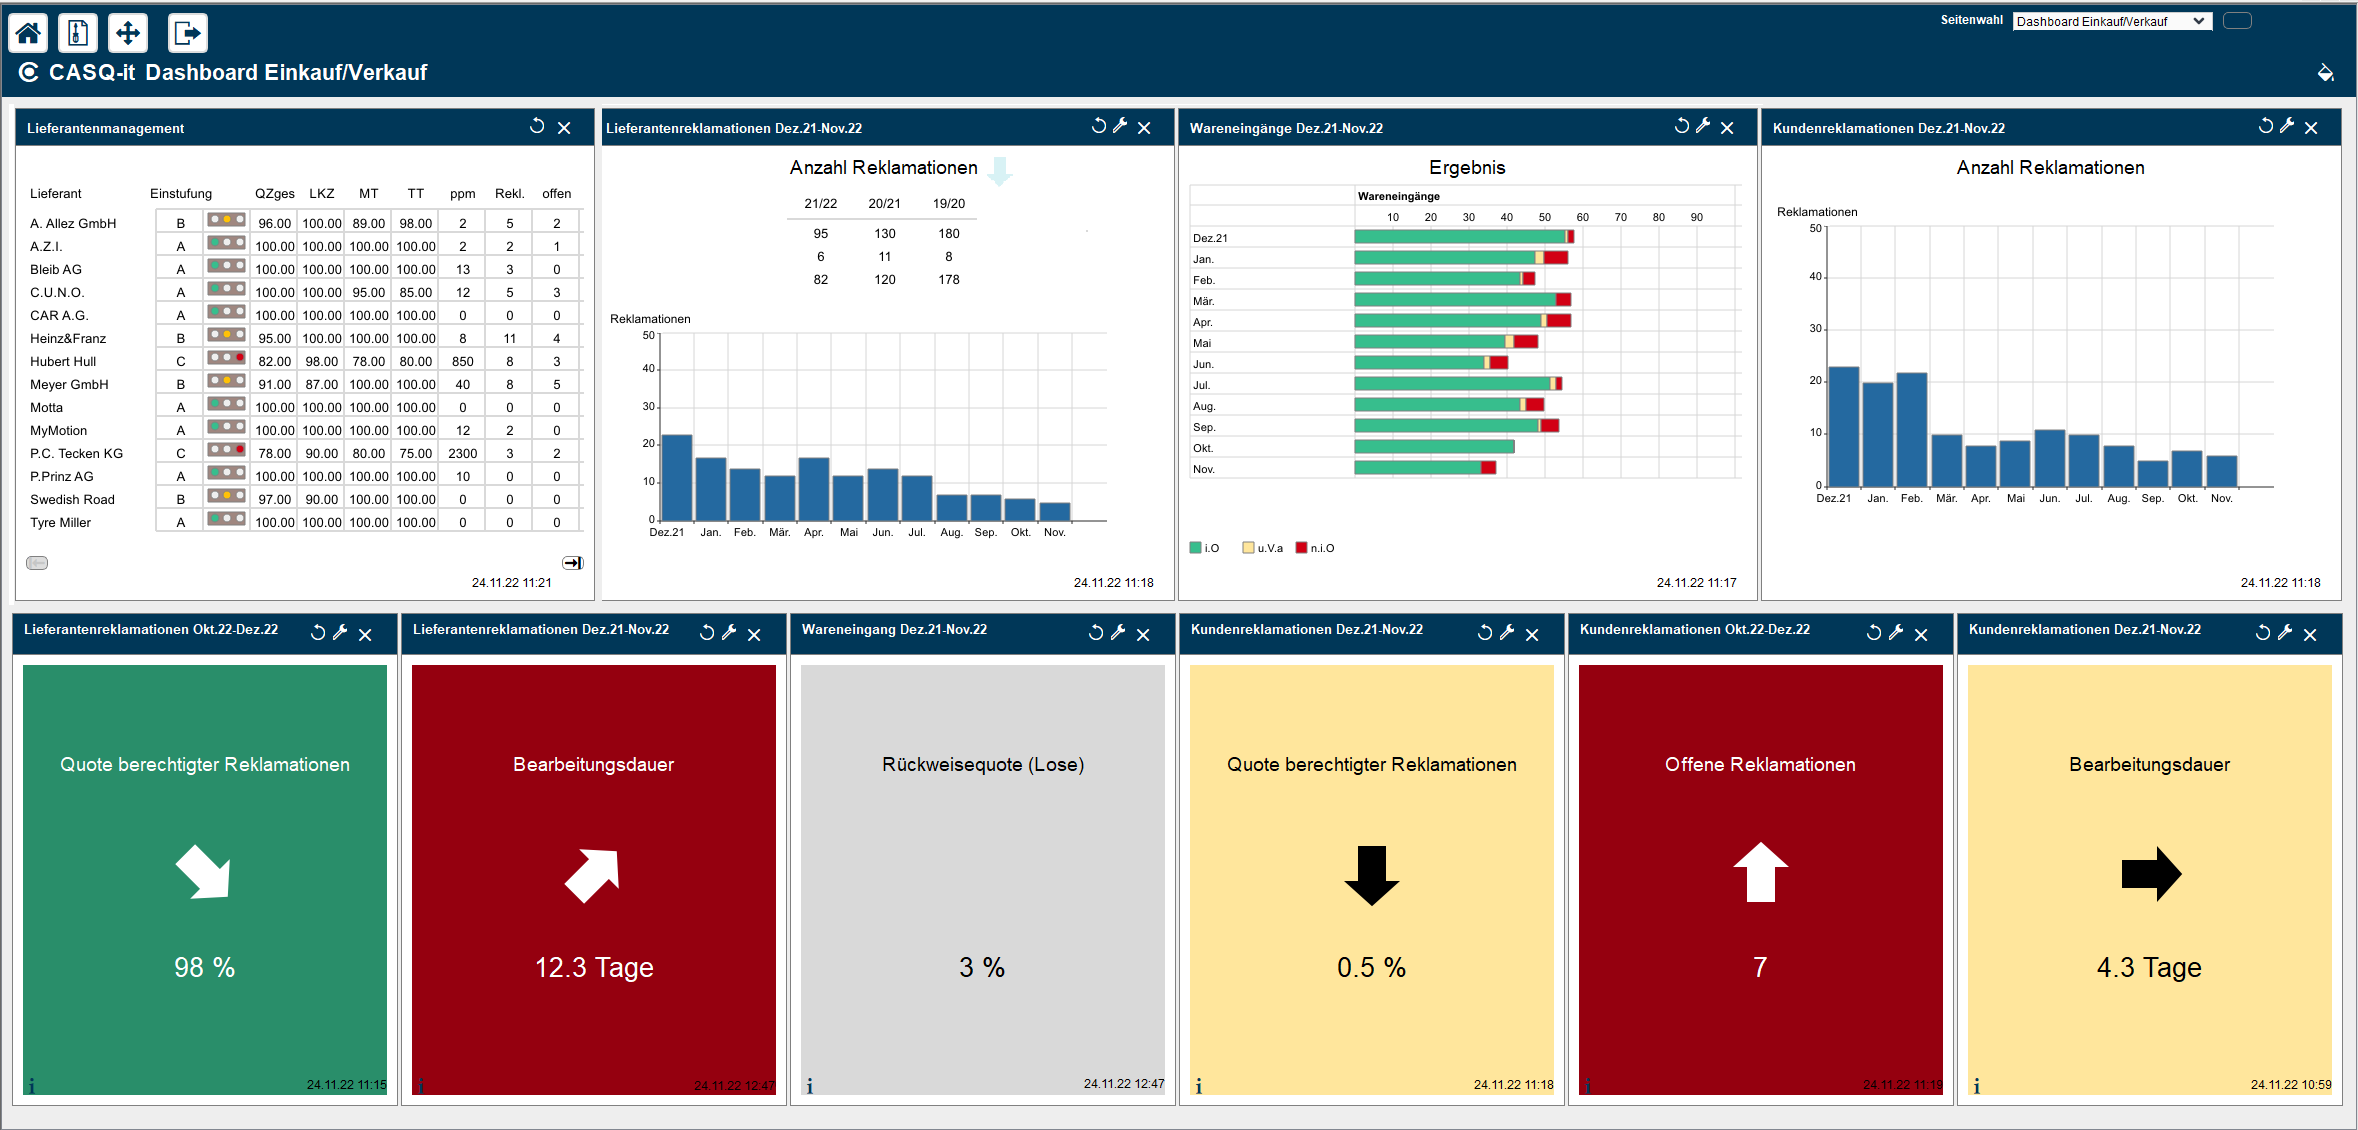
Our new CASQ-it Dashboard provides you with a compact, fast, and interactive overview. This centralized, flexible quality information system can be configured for each individual CASQ-it module. If you have the appropriate access rights , you can put together YOUR OWN individual CASQ-it Dashboard, with all your relevant widgets and processes.
So much for the general overview. Now, let us take a closer look at our CASQ-it Dashboard.
The Dashboard layout
Up to 18 widgets (mini applications that can be used interactively) can be placed on one Dashboard page. You can create a general overview where your most important KPIs and analyses are available at a glance and then add additional pages according to topic.
The CASQ-it Dashboard has a clearly-structured grid layout that makes it easy to arrange your widgets. This can be adjusted according to which widgets you choose and makes it easy to position your selected widgets using the drag & drop feature.
Choose from an ever-growing number of widgets:
- KPI-Widgets – display your indicators
- Analysis-Widgets – display diagrams
- DeepDive-Widgets – for deeper analyses
- Additional widgets – for more detailed information
A broad range of widgets
KPI-Widgets display the selected KPIs and offer additional filtering and evaluation functions. All the KPI widgets support the monitoring of targets in relation to a specific period of time. A separate widget is available to determine these targets.
Analysis-Widgets display, for example, Pareto analyses or developments over a period of time, shown in graphical form as a bar or pie chart
In the KPI-Cockpit of an analyse-Widget, you can compare analyses over a longer period of time, such as (justified) complaints over a 3-year period, for example. A trend arrow, a table containing the results, ratings, and the number of justified complaints during the last 3 years, alongside the development during the last year, are displayed graphically.
Apart from the standardized widgets DeepDive-Widgets are also available. These provide a more detailed view of the data from the individual modules, such as displaying the current status of the supplier management system, for example.
The World clock is also one of the additional widgets and shows the current time at up to 10 company locations.
Dashboard rights assignment
Rights to individual Dashboard views can be assigned to a user, a user group, or a user role. A home page view can be selected for each individual rights holder. Rights are assigned via an administration widget.
The following rights can be assigned for the following categories:
- Reading the widgets
- Calling up the widgets in order to position them accordingly
- Customizing the widget settings
Cross-module analyses for power users
For power users, the CASQ-it Dashboard can display comparative views of clients, for example locations and/or plants, in one single widget. These can then also be evaluated as a group.
Installation
Two versions of our CASQ-it Dashboard are available for installation: Versions Q15.1 and Q10.2 (with slightly restricted functionality).


